GE Healthcare DXA Whole Body Composition Analysis
GE Healthcare provides DXA ((dual energy x-ray absorptiometry) body composition assessment tools that are designed to enable clinicians to help their patients understand how diet, lifestyle and exercise programs impact overall health and human performance.
Their body composition reports are used for:
■ Clinical condition assessments to understand the cardio-metabolic health risks of patients
■ Weight management to demonstrate tangible progress & motivate patients
■ Sports medicine to monitor the effect of training and nutrition on body condition
■ Wellness assessment to enhance overall health
The images below show
1. Data visualization of the direct measurement of fat, bone and lean (the mass of the body minus the fat) with imaging tools
2. Precise results of full analysis of total body and by region, which gives clinicians the tools to help detect significant changes in body composition in a short period of time
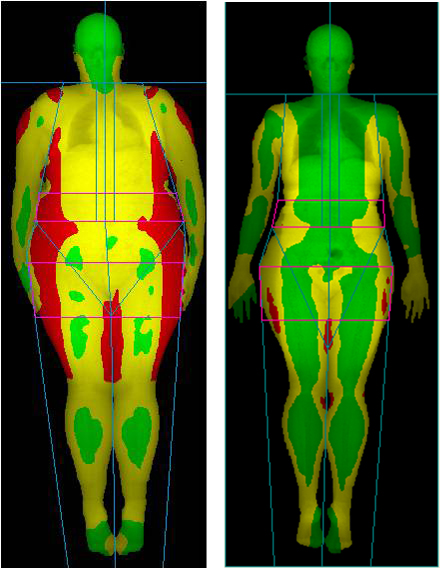
3ab (left two images). Color coded images with a clear distinction of bone, fat and lean to help you understand a person's body composition and visualize changes over time; 3cd. color mapping images to help you understand where high areas of fat are located and visualize changes over time. Different colors distinguish areas of high, medium and low fat.
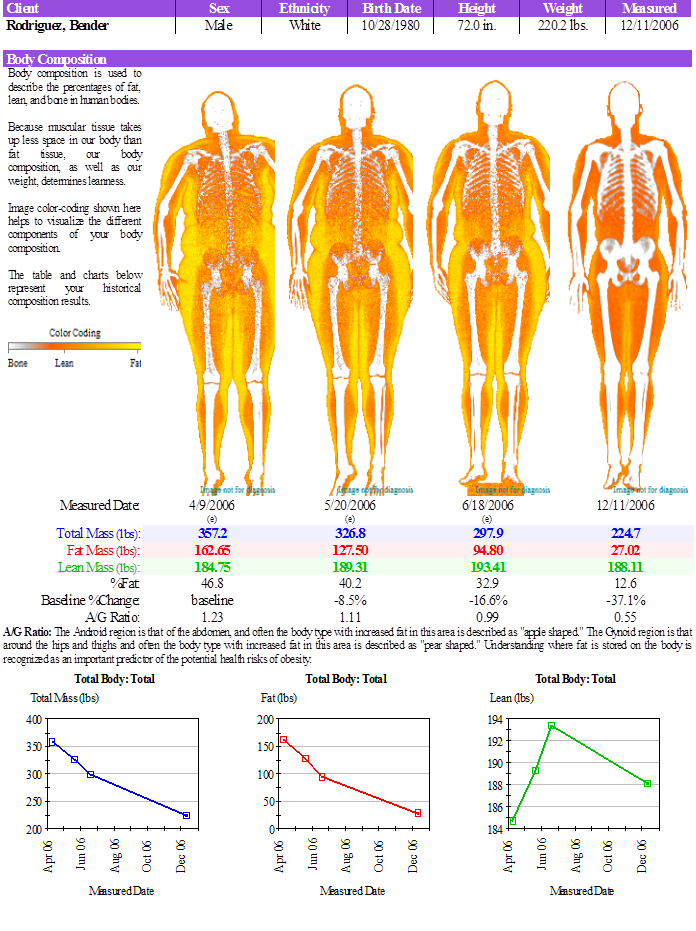
4. Graph and table with key body composition data to monitor progress over time. Data is displayed versus baseline for quick calculation of changes in fat and lean tissue.
5. Sample report page showing progress over eight months. Several standard templates are included with GE software with flexible options for creating personalized templates for reports.
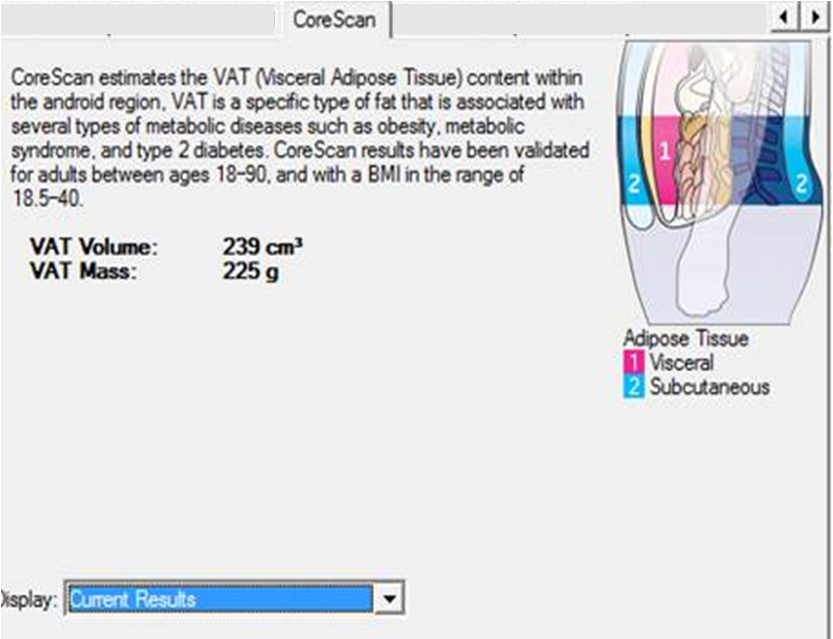
6. CoreScan application dedicated to quantifying visceral fat versus subcutaneous fat. Visceral fat is located around the abdomen and surrounding organs and is linked to problems such as bad cholesterol, diabetes, hypertension, heart disease and stroke. Subcutaneous fat is found underneath the skin and causes dimpling and cellulite.
7. GE total body bone density report
1. Imaging tools

2. Body composition analysis of fat, lean and bone

3ab (left two images). Color coded images with a clear distinction of bone, fat and lean; 3cd color mapping images to help you understand where high areas of fat are located and visualize changes over time. Different colors distinguish areas of high, medium and low fat.

4. Graph and table with key body composition data to monitor progress over time.

5. Sample report page showing progress over eight months
6. CoreScan application dedicated to quantifying visceral fat and subcutaneous fat
7. GE total body bone density report

Hologic DXA Bone Density Report
Hologic DXA Body Composition Report
Mindways QTC Bone Density Report
General Sample Reports Web Page